Sunday, February 02, 2020

"...employers are freezing the over 50s out of the job market"

A Stuff headline reads:

How employers are freezing the over 50s out of the job market
The single and over-45 population is more likely to suffer poverty than any group other than single parents and the situation is worse if you're female, Māori or Pasifika. As Kiwis are less and less financially prepared for retirement there is an older generation desperate to work - but nobody will hire them.... Caroline Nola is one of dozens Stuff spoke to this week, after we sought stories from older people struggling to find work. 
The article provides lots of stats but none that support the headline. They missed these:


50-54 year-olds have the second highest rate employment.
55-59 year-olds have a reducing employment rate but the lowest unemployment rate.
60-64 year-olds have a similar employment rate to 20-24 year-olds (71.5 versus 72.1%)

Susan St John makes an appearance saying:
There was evidence that more seniors were accessing benefits and food grants, and the welfare system did nothing to help, she said. 
Yes there is evidence. But the increase in Jobseeker benefit is much higher among 25-39 year-olds:


I feel very sorry for anyone who attends multiple interviews and gets nowhere. It's demoralising and depressing. But that scenario isn't confined to older applicants.


Friday, January 31, 2020

Food grants 39% higher than at peak of GFC

In the financial year ending 2019, food grants exceeded the number granted during the GFC - when unemployment reached 6.7% - by 38.6 percent.

In the December 2019 quarter alone, over 3,300 grants were made daily.


But I notice (as remarked on recently) that the biggest increase is not identified as occurring in town and city service centres but in an 'other' region. According to MSD:

"The ‘other’ region includes the Ministry Contact Centres and Centralised Services that do not cover a part of New Zealand. Hardship assistance is reported by the Service Centre which granted the payment, so the increase in ‘other’ indicates more of these being granted in centralised offices."
So the majority of the increase isn't from grants made face-to-face at service centres but applied for on-line (using MyMSD) or over the phone. I gather money is loaded onto a payment card and the average grant is around $100.

It's a worry for the taxpayer but it's a bigger worry for the person becoming increasingly dependent on these grants.

Update: Jim Rose asked, "Have you asked for info on rates at which applications were declined?" Not me but someone else did. I've charted the data for the last four financial years.


Wednesday, January 29, 2020

Nash goes on the offensive but gets it wrong

Minister Stuart Nash does a weekly session with National MP, Mark Mitchell, on the Mike Hosking NewstalkZB show.

This morning, before Hosking had even asked an opening question Nash waded in:

NASH: "Hey Mike I haven't heard you comment on the December figures last year when 19,000  handed in their benefit and got back to work. Was that in one of your commentaries?"

HOSKING: "It was actually Stuart. You shouldn't come on this programme and say 'I haven't heard you' because all that indicates is you're tuned into the wrong radio station. You need to be where the number one radio show is and the audience is Stuart especially now that it's election year and you need some votes.

NASH: "Well when you think there are 19,000 more people in work than were on the benefit in the last quarter that's pretty good news . That shows a great economy and good economic management I would say. Wouldn't you Mike?"

HOSKING: "Well no because my great concern is the massive increase in the people on the benefit. How do you explain that?"

NASH: "It's still a lower percentage than it was when we took over [wrong - see below]."

HOSKING: "But it's still increasing though. There are more an more people on the Jobseeker benefit - there's another 15,000 on the Jobseeker benefit and these are work-ready people. Why aren't they working?"

NASH: "But the economy's growing, we've got record low unemployment. This is the third lowest unemployment in the last ten years.Wages are rising and the economy is booming."


18,818 benefit cancellations for work is not particularly spectacular when compared to the previous  December quarters and the trend-line is down.


More importantly there were 55,341 main benefit grants in the Dec 2019 quarter - the highest number since Dec 2015.

As well, in December 2017 - just after Labour took over - 9.8% of the working age population was on a benefit. By December 2019 it had grown to 10.5%. 

In respect of the Jobseeker benefit the number grew from 4.2% to 4.9%


An election campaign that is facts-based? Honest, robust, transparent?


Tuesday, January 28, 2020

P and poverty

Started the day by reading this headline:

Kids in poverty miss start of school year, as siblings share one uniform

This continuing poverty problem is baffling. OK. High rents is a undeniable issue. But then we have children apparently living in tents and garages. That's a terrible environment for kids but no rent problem. Still no money though? And state houses are affordable, but still no money? With all the extra emergency assistance WINZ is handing out? Food and clothing has never been more accessible. Food banks, markets, recycled clothing stores, charity shops. 

Then I spent 40 mins watching Fighting the Demon. If you can get past the overly dramatic treatment of the subject I recommend it.

Apparently meth is ravaging poor small towns. Police identified 600 P users in Kawerau (out of a population of 6,000). The kids are going without food. Debt is rife. Up to Whangarei, with the highest Jobseeker rate in NZ and an addiction counselor says the business man is using meth to be more 'productive' but the beneficiary is using it to escape his existence.

Therein lies a couple of clues.

But the media never puts the two issues together.


Monday, January 27, 2020

Case manager feeling "...just like an ATM machine"

Most of us have little choice but to rely on statistics to build a picture of what is happening at Work and Income. Accordingly, anecdotal evidence has some value, especially when it is from the normally gagged front line, and despite being secondhand. I can only trust that it is genuine. Transcribed from NewstalkZB's Week on Demand  (Jan 27, 8.30 am segment, starts at 7.15) it begins with Mike Yardley reading out a text or email from a listener and then refers to an Official Information Request of mine (I believe):

"Good morning Mike, My partner works for Work and Income and she says there has definitely been a culture change with respect to client obligations and the whole benefit system has ground to a halt hence why you are seeing the massive rises in the Jobseeker/Work-Ready benefit numbers. My partner says that if you are on a  benefit now you can basically stay there indefinitely because Work and Income case mangers are not tuning you up. My partner says that she feels her job is now just like an ATM paying out money willy-nilly. There is not the case management there used to be," says Dave.

Mike continues,

"Which is an interesting point because I know there was an Official Information request on this very matter in the last few weeks and apparently, according to Work and Income they are now only spending - these are case managers - about 20% of their time helping people on a benefit into work or ensuring they are work-ready or doing some training, looking at other options...just generally trying to get them onto a more independent and productive footing. And apparently this collapse in how much time they are spending with that sort of work-focused case management is because they are doling out so many hardship assistance grants and having to wade through so many applications. I think the figures out on Thursday from MSD say there were 537,000 [573,000] hardship assistance grants given out in the last year."

Mike Yardley has also penned an opinion piece,  Benefit numbers betray Labour's posturing on well-being.

Sunday, January 26, 2020

Why are 56,000 Maori claiming Jobseeker benefit when only 27,000 are unemployed?

Jacinda Ardern went to Ratana and told Maori she was working for their collective people and that the unemployment rate was dropping. Officially the latter is true.

But that's only half of the story.

Here is the Maori unemployment rate from Statistics NZ data:


However, in September 2017 Maori overtook NZ European on the Jobseeker numbers for the first time ever. Since they have been pulling away. Here are the Jobseeker numbers from MSD data:


It seems odd that the two trajectories are going in different directions.

According to the Stats NZ data at September 2019 there were 60,200 unemployed NZ Europeans and 27,500 unemployed Maori.

You would expect the number of  unemployed to be slightly higher than on Jobseeker - some people will be neither inclined to seek nor qualify for a Jobseeker benefit. This is the case for NZ Europeans.

But there is a large mismatch between 27,500 Maori unemployed and over 56,581 on Jobseeker benefit.

From Sep 17 to Sep 19 the Maori Labour Force Participation Rate (LFPR) fell from 70.4 to 67.8 percent - a drop of 2.6 points. NZ European LFPR fell from 71.7 to 70.7 - a drop of 0.3 points.

Looking at the 'not in the labour force' numbers, for NZ European they have climbed 9,000 - a 1.1% increase. The Maori increase is 17,800 - a massive 12 percent increase.

If an individual drops out of the labour force that means they are not looking or available for work. In which case they shouldn't be receiving a Jobseeker benefit. If they have dropped out due to health/disability reasons that preclude them from work permanently, they would go on the Supported Living Payment but there is no particular increase for Maori there.

On the other hand the Maori working age population has grown much more than the NZ European population probably due to the ageing NZ European pop versus the young Maori pop. (The stats are muddied by Stats NZ classifying the working age population as 15-64. Ridiculous when you can't even leave school till 16.)

But the same demographic characteristics apply to the Pacific population and their unemployment/ Jobseeker ratio is more like the NZ European with 13,400 unemployed and 11,552 on the Jobseeker benefit.


If Jacinda thinks this is a success for Maori she is probably in a very small minority.

And as she has pledged to run an election campaign free from fake news perhaps she could start by answering the question in the title of my post.

(There is one other remote possible explanation. Around 62,000 Jobseekers have a health condition or disability and are not 'work ready'. Could they all be Maori? I am going to rule it out on the basis that when the sickness benefit was rolled into the Jobseeker benefit in 2013 Maori only made up 28 percent or around 16,600 individuals. But I will OIA it.)

Update: A commentor points to part-time employment as a reason for many more Maori than just the 'unemployed' being on a Jobseeker benefit. But the 'underutilisation' (which includes underemployment) percentage for Maori is not much higher than for Pacific - 17.6 versus 14.1 percent. So I am skeptical about that answer.

Update 2: Further reflection - it is possible that the ranks of part-time Maori workers have been swollen by ex DPB ageing single parents. But that brings us back to arguing over whether these ladies are genuinely single. If they were partnered (as they very well may have been when claiming the DPB) they shouldn't qualify for the Jobseeker benefit (unless both partners are claiming the single rate - exactly half of the married/de facto rate). So many complications.

Bottom-line is the Maori unemployment/Jobseeker ratio is utterly different from the NZ European and Pacific. And I'd like to understand why.

Friday, January 24, 2020

Thursday, January 23, 2020

Terrible start to a "factual campaign free from misinformation"

This is quite desperate stuff. The number of people on Jobseeker benefits has gone up 10 percent since December 2018. Here's Sepuloni's take:

The December quarter benefit numbers released today show the Government’s plan to get people off the benefit and into work is starting to pay off,” Social Development Minister Carmel Sepuloni said.
“Nearly 19,000 people cancelled their benefit and went into work in the last few months of the year – that’s about the population of Levin – and is the second quarter in a row that the number of people coming off the benefit and into work has increased, year on year.
When a net figure goes up the only reason is that there have been more grants than cancellations.


“The number of people on a main benefit is 314,408, which is 10.5 per cent of the working age population, remaining lower than the 11.2 per cent on a main benefit under National five years ago.
In December 2014 the unemployment rate was 5.5 percent - not 4.2%. This is feeble stuff.

The picture is bad and she really cannot explain it away.


“The Government is committed to helping people to find meaningful and sustainable work while ensuring the welfare system is fairer and more accessible for all New Zealanders. While there’s more to do, we are on the right track,” Carmel Sepuloni said.
Unbelievable. I'd don't want to see what the 'wrong' track looks like.

And right now Jacinda Ardern is in Martinborough telling her MPs she wants a "factual election campaign free from misinformation".

Update: Getting worse. Sepuloni told Magic Talk midday news,"The trajectory for the rise started before we got in."

It did not.

Tuesday, January 21, 2020

'Hand-out' prioritised over 'hand-up'

Trite as they may sometimes sound there is a good deal of wisdom in ancient proverbs:

Give a Man a Fish, and You Feed Him for a Day. Teach a Man To Fish, and You Feed Him for a Lifetime

The following is a quote from the latest MSD Annual Report:

The increase in demand for financial assistance this year has impacted on the time our case managers can spend with clients on proactive employment-focused case management: only 20 percent of engagements with clients in June 2019 had an employment focus, the lowest proportion since 2014.

A significant element in extra financial assistance is Food Grants.


A 72% increase in 2 years.

Regionally, most of the food grant increase is classified as 'other' so one can only assume the applicant has no fixed address. The objection is commonly made that you can't get someone into a job if they have no fixed address. Yet MSD matches thousands of temporary visitors to jobs every year.

Ardern's government has prioritised a hand-out over a hand-up and the 'need' only grows.

Sunday, January 19, 2020

Fairness or Freedom?

The Daily Blog links to a column published in the Guardian by Bryce Edwards. It begins:

If New Zealand had a giant monument at the entrance to Auckland or Wellington harbour it would be a “Statue of Equality” not liberty, or so said visiting American political scientist Leslie Lipson who wrote a book about our politics in the 1940s.
New Zealanders have long held dear the notion of fairness, and Lipson’s reflection remains true today. 
And concludes:

 ...if Labour and its coalition partners can keep public debate around traditional egalitarian concerns about inequality, housing, health and education, the New Zealand notion of fairness will probably also ensure her government will get another chance.
Intrigued I had a look at the Lipson book. Some further context:


'Fairness' is of course a highly subjective notion. One man's fairness is the next man's injustice. That's why politicians should not be trusted to deal in it.

Freedom on the other hand restricts the use of force by politicians to impose their particular brand of 'fairness'. I know which I rate more highly.

Thursday, January 16, 2020

Dodgy stats

This table is taken from the statistical snapshot that informs the Children's Commissioner widely reported comments about inequity between the Oranga Tamariki's treatment of Maori and non Maori babies pre and post-birth:

Notice that the number of 'Ethinicity [sic] not specified' has climbed significantly since 2004 when they numbered just 3 - or 1.6% of all reports. Last year they numbered 336 - or 21.8% of all reports.

Now, the more babies that are removed from the non-Maori group the greater the gap grows between Maori and non-Maori.

Look at it this way. In 2004 Maori reports made up 53 percent of the total. And in 2019 Maori reports made up ... 53 percent of the total.

I don't think any conclusive claim can be made about Maori versus non-Maori with such a significant non-specified group. For instance, "There were eight times more concerns reported for unborn Māori babies in 2019, as compared with 2004. In that same time, reported concerns for non-Māori increased only 4.5 times."

And it leaves a question mark over the rest of the data pertaining to 0-3 month olds.

Is the removal of Maori babies "racism and bias"?


According to RNZ:
"Māori babies were five times more likely to end up in state care than non-Māori last year and their rate of urgent entries into state care has doubled since 2010, official figures show.
In that same period, 61 Māori babies were ordered into state care before they were born, compared to just 21 non-Māori.
Children's Commissioner Judge Andrew Becroft released the statistics this morning as part of a widescale inquiry into the removal of Māori babies, aged up to three months old, by the state.
That age group had been selected because that was where the statistics showed there were problems, and because it was a crucial bonding time for mother and child.
Judge Becroft said the figures raised clear questions about racism and bias within the state care sector.
"I've said previously that it's impossible to factor out the enduring legacy of colonisation... or modern day systemic bias," he said.
"Now that, to some extent, will obviously be at play here as it is across all decision-making and all government departments."
The inequities for Māori had grown over time and continued to worsen, Judge Becroft said."
 Is it not also possible that the high degree of risk-aversion rife through the public service is playing a role? After all the  rate of child abuse and neglect deaths has also been much higher among Maori children.

Previously I have posted the official stats as published by the Family Violence Death Review Committee. The most recent:


If the risk is greater based on factual evidence, and authorities act on that known risk, is that "racism and bias"?

But I also have sympathy for those who are decrying the high rate of removal. Personally nothing riles me more than laws, regulations and processes designed to tackle a small minority of offenders being over-zealously or even universally applied.


Wednesday, January 15, 2020

Children threatening to report parents

Looking at poll results commissioned by Family First regarding the anti-smacking law a couple of things stood out.
22% of parents with young children said their child had threatened to report them to the authorities if they were smacked
Coincidentally I overheard a conversation between a Maori and Pacific family in a hospital waiting room recently. Grandparents were comparing number of mokopuna. The Maori lady expressed a view that her mokopuna were scared of her because they knew she was tough, whereas they would manipulate their parents by threatening to call the cops if they were smacked.

That may be a good or bad thing. Maybe it serves the purpose of cooling the parent down momentarily. But maybe the better result is that the child stops whatever behaviour is heading for a smack. Whatever the case the children may fear the grandmother more but they also respect her more.

I wonder if children also threaten to call the authorities if they are under the age of 14 and left alone?

Somehow I doubt it.
50% of respondents said that despite the law they would smack their child to correct their behaviour if reasonable to do so.
A law that is so widely disregarded is not good law.

But we seem to have plenty of them.

Thursday, January 09, 2020

Fact or fib?

Working through more of MSD's published OIA responses, one topic caught my eye. This'll be interesting I thought. It was. It's one of mine!

It concerns a state-sponsored 'fact' which isn't.

Here's screenshot from a current on-line 'fact sheet' published under the auspices of the Welfare Expert Advisory Group, furnished by information provided by MSD:


If the claim had been,"Over 50% of  children growing up in households receiving a main benefit are Maori," I wouldn't have blinked. But as it stands I am deeply suspicious.

MSD has now published my OIA request for verification of source and their response:


Contained therein:


So where did it come from?

6 months on, no action has been taken to remove this unverified 'fact'.

What the hell. Under this government it will probably become true at some point.

Monday, January 06, 2020

Motel charges premium for emergency housing

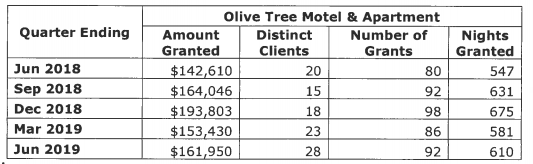
At long last MSD has updated OIA requests. Responses up to November 2019 are on-line and always make for interesting reading. For instance payments made to the Olive Tree Motel for emergency housing.

Clients are granted an amount which is paid directly to the motel.


In the June 2019 quarter the motel was receiving $265 per night.

But nightly charges per unit range from $145 to $165 according to their website. Charges reduce for longer stays.

Another request reveals that over 600 accommodation providers  received emergency grants in the June 2019 quarter. How many share a similar premium policy? It's certainly a booming 'industry' with a 49 percent increase in average grant between Sep 17 quarter and June 19 quarter:


I leave the comments to readers.

Saturday, January 04, 2020

My prediction Ardern would increase child poverty

New Year seems to be a time when predictions are checked. In September 2017 I predicted Jacinda Ardern would increase child poverty if she became Prime Minister.

On 7 of 9 measures introduced under the Child Poverty Reduction Act, to June 2018 poverty had increased. That's fairly out-dated data now and not a particularly useful measuring stick.

But also now known is that children in benefit dependent households rose between June 2018 and 2019. From Otago University's Child Poverty Monitor:


It's not a big rise but it's the first in 10 years.

I argued, and still do, that despite studying the child poverty problem as Labour spokesperson for six years, Ardern didn't understand the drivers.

Essentially the more a country chooses to decrease poverty through redistribution, the more joblessness grows.  It is well documented now that despite having low unemployment, numbers on the jobseeker benefit - and more recently the sole parent benefit - have increased. The kind of people who choose not to work when they could, aren't necessarily stupid. But they are quite probably not good money-managers.  For instance, they don't prioritise their children's needs. There is usually wisdom behind old adages. In this case, 'Easy come, easy go.'

I don't know if the Left will ever figure out that state-enforced redistribution to the poor doesn't solve their problems in a meaningful or sustained way. It won't under this leader anyway.

But here's an election year question for you to ponder. If Ardern claims this year that her Families Package has reduced child poverty (BUT more children are in non-working homes) is that a success?


Wednesday, January 01, 2020

Stuff and Inequality - only half the story

2020 just hours old and that hoary old chestnut is already rolled out. The rich are getting richer and the poor are getting poorer!

From Stuff where only half of the story is ever provided:
Rasbrooke said the data that was available suggested wealth inequality had worsened in the past decade or two..."There are very few demands on wealthy people in New Zealand, no meaningful taxes on their wealth."

From New Zealand's official source on household incomes (my emphasis):

New Zealand does not have a robust time series on wealth inequality, so we do not know if there are any changes in this aspect of household resources.

 Household income inequality in New Zealand is a little above average for OECD countries and wealth inequality is about average

New Zealand’s wealth inequality is about average for the OECD, with the top 10% of households holding around 50% of all household wealth.

As for other OECD countries, household wealth inequality in New Zealand is greater than income inequality. New Zealand ranks in the middle of the table, with around 50% of wealth held by the top 10%, similar to Canada, Norway and France. For the USA, 76% is held by the top 10%.

The Gini measure of inequality is a popular one but, because it uses information on all household incomes, it is susceptible to showing large fluctuations because of sampling issues for very high income households. The report therefore highlights the Gini trend for the lower 99%. There is no evidence of any sustained rising or falling trend in the last 25 years for the lower 99%, using the Gini. 

There is no evidence of any sustained rising or falling trend for BHC [before housing costs] income inequality, with New Zealand levels a little above the OECD average and similar to Australia. The share of total income received by the top 1% has been steady in the 8-9% range since 1990, similar to Finland and Norway, a little lower than Australia, and much lower than the UK (14% in 2015) and the US (20% in 2015).

Tuesday, December 31, 2019

Bush fire headlines

The idea that 'We live in apocalyptic times' might be misguided.

Questioning the idea might equally be challenged.

To satisfy my own curiosity I searched 'bush fires' in Papers Past.

1915

Read more

1936

Read more

1946

Read more


Wednesday, December 18, 2019

Just 'cause it's in the paper doesn't make it true

Not on-line but here is a quote from a Stuff journalist expressing opinion in today's Dominion Post:


My BS detector always goes off when I read claims about big economic differences between New Zealand and other first world English-speaking countries.

Here apples are not being compared with apples. Coughlan has compared NZ 'core' spending with UK 'total'.

The two following graphs show similar trajectories (as you would expect). In 2019 NZ spending 37.1% of GDP and the UK 39.4%

Total Crown Expenses

Public Spending as a percentage of GDP in the UK


Tuesday, December 17, 2019

"...continued creep of managerialism"

Opinion by Mark Blackham published in today's Dominion Post:

The response to the White Island tragedy is a stark insight into the continued creep of managerialism. It undermines the ability of state services to help citizens, but empowers it to infantilise us.
We're discouraged from acting on our own, and forced to bow to experts. Yet systems and fancy talk prevent experts taking substantive action for fear of career, safety, or arbitrary consequences for taking the "wrong" action. In these environments, there are no career prospects for heroes.