Saturday, August 29, 2020

The oft repeated error about 1991 benefit cuts


This letter seems to be affirming what mine said about familiy stability - not cash hand-outs - improving a child's prospects. The writer grew up in a state house with security of tenure and a loving mother. Lone parents can also provide stability and security.

But I wanted to take issue with the last section because it's an error often repeated.

Benefits to sole mothers were not cut by 25%. From Tim Garlick's 'Social Developments': "Lone parents faced significant cuts: 10.7 percent for beneficiaries with one child; 8.9 percent for those with two children." 

At the same time means-tested Family Support for beneficiary children was increased and Community Services cards were introduced to subsidise health services for low income. 

In addition the maximum Child Care subsidy increased from $32 to $65 per week to assist parents to take employment.

The latter developments from the reform period have been forgotten over time.


Wednesday, August 26, 2020

John Tamihere romanticising Maori crime

According to John Tamihere, who has regrettably in my view taken the Maori Party down a  full-blown victimhood track:

Māori make up 60% of the prison population in New Zealand Women’s’ Prisons alone.

“We are the most incarcerated indigenous population in the world. This is a national catastrophe and disgrace,” Tamihere said

“80% of those women are there for crimes of dishonesty. They did not wake up and say to themselves today I’m going to steal and be dishonest,” he said.

“They woke up and said I have to put food on my table. I have to get my kids to the doctors. I have to pay for their uniforms. I have to give them things that others take for granted. So they are in prison for crimes of poverty – not dishonesty.

It's a self-deluded romantic apologist view. 

The following stats are exported from customised NZStat data:


2018-19 sentenced population = 519

Which could be classed as 'crimes of dishonesty'?

Robbery etc

Burglary etc

Theft etc

Fraud etc

Offences against justice etc

= 327

63 percent

Dancing on a pinhead John might say when all crimes are taken into account his 80% is true. The graph will show the most serious crime sentenced for.

But semantics aside, do you accept that these crimes were perpetrated to acquire school uniforms and doctor visits for children?

Afterall tens of thousands other Maori mums didn't turn to crime to look after their children.

Something has changed for the better

 There was a period which extended to a few years when the DomPost ignored my letters. People used to ask me why I'd stopped writing them. I didn't. But something has changed and they are now printing my submissions for which I am very grateful.


Tuesday, August 25, 2020

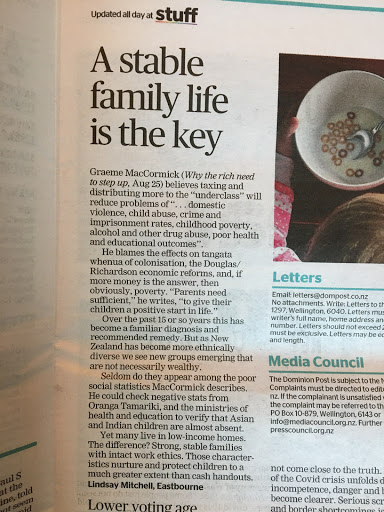
Low income families do not universally appear in poor social statistics

 Another who thinks more money thrown at the problems of the "underclass" will make them go away.

Graeme MacCormick  believes taxing and distributing more to the "underclass" will reduce problems of, "...domestic violence, child abuse, crime and imprisonment rates, childhood poverty, alcohol and other drug abuse, poor health and educational outcomes." He blames the effects of colonisation on the tangata whenua,  the Douglas/Richardson economic reforms, and, if more money is the answer, than obviously, poverty. "Parents need sufficient" he writes "to give their children a positive start in life."

Over the past fifteen or so years this has become a familiar diagnosis and recommended remedy. But as New Zealand has become more ethnically diverse we see new groups emerging that are not necessarily wealthy. Seldom do they appear among the poor social statistics MacCormick describes. He could check negative stats from Oranga Tamariki,  and the Ministries of Health and Education to verify that Asian and Indian children are almost absent. Yet many live in low income homes. The difference? Strong, stable families with intact work ethics. Those characteristics nurture and protect children to a much greater extent than cash hand-outs. 

Monday, August 24, 2020

David Seymour: Quote of the Day


Describing the Prime Minister’s daily address, the ad nauseam “wash your hands and be kind,” tonight's TV3 News had Seymour saying,  


“The last time I was talked to like that was when I attended Horahora kindergarten.”

Relationship between benefit receipt and unemployment

 From MSD:

Trends in main benefit receipt are associated with the official unemployment rate


1. The Depression (D)– 1930s
2. The Wool Bust – (WB) mid-1960s
3. The First Oil Shock – (FOS) mid 1970s
4. The Second Oil Shock – (SOS) 1979 to early-1980s
5. Black Monday and the restructuring events of the 1980s and early 1990s –
(BMER) 1987-1992
6. The Asian Crises – (AC) late 1990s/early 2000s
7. The Global Financial Crises – (GFC) 2008 and arguably ongoing7
8. COVID-19 – (C19)


During the Depression (D) there were no unemployment benefits - just government work schemes.

Then there was a long sustained period of 'full' employment. This was aided by award rates, subsidies and low participation of women in the labourforce. Through stages 3,4 and 5 something unusual happened. The unemployment rate rose steeply paralleled understandably by receipt of benefits. But benefits overshot unemployment by a large margin through the early nineties and the gap has persisted since. Incapacity and sole parent benefits made the difference. If more families had remained intact the two lines would have stayed closer to each other. The male breadwinners set adrift often never worked again and ended up on invalid and sickness benefits which increasingly featured incapacity for psychiatric and psychological reasons adding to the gap.

So the title of the graph, "Trends in main benefit receipt are associated with the official unemployment rate" is on one hand an accurate description. But there were and are other social trends influencing the relationship.


Sunday, August 23, 2020

Outrageous claim from a "trustworthy" source

Michelle Duff claims in an 'analysis' for "trustworthy, accurate and reliable" Stuff:

90 per cent of those who have lost their jobs post-Covid are women

Yesterday I quoted another source that debunked the number.

The shocking revelation – that of the 11,000 fewer people in paid employment, 10,000 of them were women - should be taken with a grain of salt, said KiwiBank economist Mary Jo Vergara, because the level of disruption during lockdown made it hard to conduct the survey.

“But I think the message there is clear - even if you adjust for some anomalies in the data you’d still see over 50 per cent, probably around 60 or 70 per cent of those who lost their jobs, would be women.”

But let's check the claim against MSD data:


(Left click on image to enlarge)

The annual increase uptake of Jobseeker benefit was GREATER for males.

It could be argued that females get locked out of Jobseeker if they have a working partner.

But that did not apply to the Covid Income Relief Payment for people made redundant after March.


The monthly increase uptake of  CIRP was GREATER for males.

And 22% more males than females are receiving CIRP.

This outrageous claim will become an urban myth unless we arm ourselves with the facts and reject it.