MSD's annual tome of poverty statistics was released last week.
The NZ Initiative provides a good summary here. Eric Crampton wryly notes:
"Spin machines revved up quickly, trying to find the least indefensible ways of using the data to support whatever position they had before they’d opened the report."
For mine, of interest, was a new section on foodbank use. I have graphed the data below interested in the relationship between foodbank use and child poverty.
The data features children aged 0-17 in primarily the Auckland region. Foodbank use is at least once in the last 12 months. AHC 50 relates to the percentage of children in households below fifty percent of the median income After Housing Costs and MH 9+ relates to the percentage of children experiencing 9 or more items of material hardship eg going without fresh fruit or doctor visits.
Unsurprisingly in every area the relationship is similar. But it is certainly not uniform. The shapes of each area cluster differ.
The ratio of AHC50 to foodbank-use shortens moving left to right. In Albert etc. 14 percent are at AHC 50 and 3 percent used foodbanks. In Southern wards the numbers are respectively 25 and 19 percent. The gap is much narrower.
Without knowing how many times beyond once a foodbank was used, the dependency appears disproportionately greater moving left to right.
This might reflect a greater density of foodbanks in poorer areas.
But I also notice the marginal relationship between AHC50 (financial hardship) and MH9+ (material hardship) is not constant. It too tends to close but Western and Howick etc. have the biggest margins. This says to me that low incomes in those areas go further. Perhaps caregivers budget better. Perhaps they carry less debt. There could be a myriad of reasons.
Theories about how to measure poverty have been multiple and varied through the ages. The study of poverty has historic roots. But some have argued it might be better identified and understood by measuring not what goes into a house but what goes out. Expenditure counts as much as income.
This particular report arises from income and says, "The use of expenditure is not generally accepted as an alternative, in part because it also is not a good proxy for reporting consumption possibilities, but also because the quality of the expenditure data is often patchy."
Fair enough but not enough is known about expenditure (bar housing) to properly understand what might make a positive difference. And that is the point of these reports.
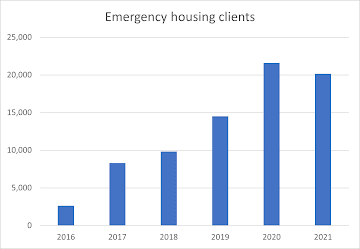
(The report does not, by the way, capture recent data or people living in emergency housing.)


