Thursday, January 12, 2023

PM more self-delusional by the day

Prime Minister Jacinda Ardern is heading into the 2023 election campaign stating:


“Our record is growing Māori housing. Our record is growing Māori employment opportunities. Now our record is growing the Māori economy. I will happily campaign on our record.”


I really don't have a lot of stomach for this. Most Māori are working and law-abiding like most non-Māori and the constant racial identification of people only feeds resentment and division.

BUT if the Prime Minister wants to crow about what she has achieved for Māori let's look at what she hasn't achieved for Māori.

Since 2017, the Māori percentage of all people on main benefits has risen from 35.9 to 37.2% - in raw numbers from 99,351 to 128,502

Māori now make up 38.6 percent of those on a Jobseeker benefit - up from 37.6 %. Again, in raw numbers (despite the drop in the unemployment rate) there are over twenty thousand more Māori on the Jobseeker benefit than there were in 2017 (45,357 to 65,706).

The percentage Māori make up of the Sole Parent Support benefit has risen from 47.8 to 48.2% or 28,413 to 35,151.

Possibly the worst statistic in terms of Māori children's future prospects, absenteeism - as defined by attending school less than 70 percent of the time - has risen from 10.5 in 2017 to 23.8 percent in 2022 (term 2).

The Māori share of the prison population continues to climb - 50.7 to 53 percent (although the actual prisoner numbers have dropped due to Labour's policy to drive down the prison population by admitting fewer criminals and releasing earlier).

Finally, in a by no means exhaustive list, the Māori share of the public housing waiting list has grown from 44 to 49.6 percent or 3,389 to 14,130. A massive increase in raw numbers.

The data is summarized below:


If this is the Prime Minister's idea of achieving for Māori, then she is even more self-delusional than I'd previously entertained.

And if she is returned on this record then we are all deeply in trouble. All of us together.

Sources

https://www.msd.govt.nz/about-msd-and-our-work/publications-resources/statistics/benefit/index.html

https://www.educationcounts.govt.nz/statistics/attendance

https://www.corrections.govt.nz/resources/statistics/quarterly_prison_statistics

https://www.msd.govt.nz/documents/about-msd-and-our-work/publications-resources/statistics/housing/datafiles/2022/oct/ph-national-monthly-timeseries-datafile-october-2022.xlsx
https://www.msd.govt.nz/documents/about-msd-and-our-work/work-programmes/social-housing/housing-quarterly-report-dec2017.pdf


Thursday, January 05, 2023

The price of reducing poverty

The benefit system was originally about providing secure income for those genuinely unable to work. That inability to work did not include causing one's own incapacity or having dependent children.

It has since evolved to become a government tool for equalizing incomes between the employed and unemployed and advancing other ideological goals like the financial emancipation of the female parent from the male parent.

To some degree benefits have become an alternative source of income for those uninterested in the obligations and constrictions involved with being employed. Those who disagree with that statement argue nobody would willingly choose to live on a meagre benefit income. 

That may hold water for single people. But the latest incomes monitoring report from MSD shows a couple on a benefit with two or more children receives over $800 weekly after housing costs. Additionally,

In real terms, total incomes after housing costs of people supported by main benefits were, on average, 43% higher in 2022 than in 2018.

Which brings us to the gap between income from benefits and income from work.


Until 2016 wage growth outstripped inflation hence the growing gap. Since 2019 benefits have been indexed to wages. Previously they were only indexed to inflation. Accordingly, the report notes the 2022 "main benefit increases reduced the gap". That is, income from work became less attractive.

As well,

...there are still reasonably poor financial incentives to increase the level of hours worked for many low-income families. This is because when earnings increase, their income support payments are withdrawn relatively quickly. High childcare costs and low take-up of in-work assistance can also have a negative impact on financial incentives to increase hours of work.

Little wonder worker shortages are endemic.

So, the income support/benefit system is contributing negatively to the economy in that regard.

But worse, it is being used by the Prime Minister to achieve her primary goal of reducing child poverty. 

According to the report, using Labour's chosen measures which show percentage drops since 2017, she has been successful in this endeavour.

What is omitted from this report is the increasing number of children reliant on benefits. 


Is this increase a reasonable trade-off for reducing child poverty? If the higher incidence of neglect and abuse for children growing up on a benefit is acceptable, then the answer is yes.

I disagree. The increase may even be described as the exploitation of children to make the Prime Minister look good. There is no reason why the welcome downward trend for state-dependent sole parents would have reversed bar financial encouragement.

Another finding from the report throws a further spanner into the works for redistributionists.

Asian households feature the lowest percentage of children experiencing material hardship - around 4% compared to the Pacific rate of around 24%

And yet when it comes to income support:

Eligible families with Asian parents had low estimated take-up in recent years. The late 2010s was a period of rapid growth in the Asian population of Aotearoa New Zealand. Low awareness, uncertainty about entitlements, administrative, personal and cultural barriers to claiming, or reluctance to claim payments among recent migrants may be factors explaining the trends. 

So the benefit system cannot be credited with low Asian hardship. Something else is protecting their children. Probably the self-reliance and work ethic of their parents.

The government can fiddle all it wants robbing Peter to pay Paul under the guise of 'fairness and equity'. But the downsides to this interference are corrupting incentives which will continue to blight New Zealand's future.


Sunday, December 18, 2022

NZ's rarely-reported plummeting prison population

Appalling crime story after appalling crime story gets reported.

But media rarely report on the big decline in New Zealand's prison population.


There are various possible explanations for the reduction including demographic change, policy changes in police and justice procedures, and/or less imprisonable crime being committed. Government politicians claim less crime is being committed, especially by youth, "according to the statistics". But the statistics they use - apprehension, prosecution and conviction - rely on those activities actually occurring. If the police are instructed not to pursue a fleeing vehicle, then the ensuing apprehension etc. is less likely to happen.

When Labour became government Kelvin Davis stated a goal of reducing the prison population and set about doing so. This is one policy goal they've actually achieved. But at what cost?

The prison population reduced by over twenty percent between September 2019 and 2022. It could be said that one in five people who should be in prison are not so it's hardly surprising the country is experiencing a "crime wave". But that proposition is barely provable.

What we can usefully look at is how New Zealand compares to two very similar countries - Australia and the United Kingdom.

The first chart shows the change in numbers:


The large difference in prison population numbers disguises the degree of change so I've plotted percentage-change separately:


The last grouping shows that between 2019 and 2022 Australia (-4.8%) and the UK (-3%) also saw prison population falls but they are much smaller than NZ's (-20.7%)

The deviation implies NZ's decline is very much a matter of policy and not the social and demographic factors that affect prison populations.

You will note from the first chart that the NZ prison population is starting to climb again. A campaign to attract more staff to Corrections has been high profile. The government may now be abandoning their experiment.

Tragically it is too late for some though.

Bill English may have been right when he described prisons as a fiscal and moral failure. They certainly don't rehabilitate every inmate. They don't even come close. Far more needs to be done within prisons in that regard.

But prisons serve another purpose. They protect the public from dangerous people. That aspect of their place in society seems to have been overlooked in recent years.

Thursday, December 01, 2022

New Zealand - No longer a secular state

 An ODT opinion piece recently parodied the rapid adoption of Māori names for government departments. It drew attention to the renaming of the Earthquake Commission as Toka Tū Ake EQC which apparently "reflects the whakapapa of our nation." The name-change decision was made by the Minister and cabinet.

The Commission site contains a section about their new Māori name.
In the beginning, Ranginui (sky father) and Papatūānuku (earth mother) were joined in such a strong embrace it created darkness. When their sons separated them to create light, Ranginui grieved so much for Papatūānuku that his tears flooded the land. Their sons turned Papatūānuku over so their parents would not face each other and see each other’s sorrow.
Rūaumoko is the youngest, unborn son of Ranginui and Papatūānuku. He was turned toward the earth in his mother’s womb. His brothers gave him fire so he could warm himself in the darkness. Being so closely tied with his mother, Rūaumoko felt her pain at the separation. When he stirs, he expresses his anger through geothermal currents, earthquakes, and volcanic eruptions. As we live alongside Rūaumoko’s rumblings and Ranginui’s tears, EQC’s role is to help make our homes stronger, ensure new homes are built on better land, and provide support when damage occurs.
Are these characters any different to Adam and Eve? Creation myths sit at the basis of religious belief. Imagine then Christian biblical stories and imagery appearing on Ministry websites to explain their reason for being and values. It would not happen.
In a 2013 Otago University lecture Andrew Bradstock said:
"...there is a shared perception here that religion is principally for the private not the public domain. This was given a degree of official endorsement in July 2010 when a draft report on “Human Rights in New Zealand Today” was released by the Human Rights Commission. This carried a statement that “Matters of religion and belief are deemed to be a matter for the private, rather than the public, sphere.” The wording was subsequently changed following complaints (though the text is still on the HRC website), but it would be hard to dispute the claim that we generally feel more comfortable if individuals or organisations, when speaking publicly, refrain from parading openly any religious convictions they may have."
Doesn't the promotion of Māori mythology fall into the domain of parading religious convictions?

And it isn't just the Earthquake Commission.

The Reserve Bank postulates,
"How Tāne Mahuta can explain our financial system. Māori oral traditions tell us that Tāne Mahuta dug his shoulders into Papatuanuku (earth mother) and used his legs to push against Ranginui (sky father), separating them and letting the light into the world. With that light, Tāne Mahuta, guardian of the forest and birds, enabled life to thrive."
The Climate Change Commission explains its Māori name, He Pou a Rangi: Ingoa Māori:
"The simplest translation of He Pou a Rangi is 'a pillar of the sky'. The concept considers our role as upholders of the sky. We are honouring the sky and in turn, have a duty to care for it. Using 'He' Pou ('a' pillar) rather than 'Te' Pou ('the' pillar) recognises that we are one of many pou or organisations working together to address climate change. Pou can uphold, provide a point of connection, protect, and provide stability. In a te ao Māori view, pou provide a two-way connection, both upholding and uplifting what is above, but also connecting and grounding with what is below. Pou connect Ranginui, the sky father, to Papatūānuku, the earth mother."
There are many more examples occurring across various government websites and in the documents they generate. Law lecturer David Griffiths refers to, "...state concessions to indigenous Māori spirituality that are now commonplace in legislation and other governmental actions." That was sixteen years ago.
Ironically, and somewhat inexplicably, the developments have been accommodated by people who have no truck with Christianity - liberal atheists. The pace of change has accelerated under the woke left.
Back in 1996 Justice Heron argued 'the courts were “secular” institutions and he declared that “involving any person in a karakia against their personal wishes” was “insensitive and unacceptable” '.
Yet a recent meeting of state-employed health professionals with no Māori people in attendance still featured the obligatory karakia delivered by a non-Māori female. When asked why, the answer received was, "Their belief in equity." Was a Christian or any other prayer offered? No. So much for equity.

Just as people balk at the imposition of mythology to explain matters of science, there will be those discomfited by the routine practise of karakia (especially given the diversity of cultures and beliefs of those working within the New Zealand health system, which is almost entirely publicly run).
The solution is not to start offering sops to every other religious belief that exists in New Zealand. To put it crudely - two wrongs do not make a right.
The answer is to re-establish the traditional and necessary secularism of the state. In the United Kingdom where awareness and objection to the problem is more acute, an organisation has formed which maintains,
"Public services that are intended for the whole community, especially those funded by public money, should be provided in a secular context, open to all, without discriminating against anyone on grounds of religion/belief – either the people who are served or employed."
Amen to that - or whatever the secular equivalent is.

Monday, November 21, 2022

Am I the only person who reads MSD's annual reports?

Am I the only person who has read MSD's latest annual report?

It's a tedious business but surely a few checkers cast their eyes over it prior to publication.

I was casting my own over the benefit statistics by region when I stopped in my tracks.


According to the above table 77.3% of people on benefits in June 2022 in the Southern region (which encompasses Dunedin, Central Otago and Invercargill) were Māori.

That's extraordinary. 

I checked the other two South Island regions - Canterbury and Nelson-Marlborough-West Coast - to find similar proportions at respectively 71.2 and 77.7 %

This is astounding news to me. Māori make up 17 percent of the population nationally but lower percentages in the South Island. For instance, at the last census only 9.4% of the Canterbury population identified as Māori.

When a statistic is so out of whack the obvious recourse is to check it against another source.

MSD  regional data for Canterbury June 2022 shows Māori made up just 21.1% of all people on benefits whereas NZ European accounted for 71.2 percent.

The data has been inverted.

But the error isn't even consistent.

There are eleven regions and tables contained in the annual report.

The data is correct for just three - Northland, Auckland and Waikato.

What surprises me is that even faint familiarity with MSD data would set off alarm bells. It is simply implausible that 77 percent of beneficiaries in the Southern region are Māori.

If that's wrong what else might be?

I returned to the table above and took another look. Apparently, 26.9 percent of beneficiaries in the Southern region have been on a benefit for one year or less; 45.8 percent for more than one year. That sums to 72.7 percent.

What about the rest?

Of course this could all be dismissed as trivial errors.

But if funding is to be race-based in any manner then accurate numbers are extremely important. 

The idea is bad enough. Poor execution of it is salt in the wound.


Sunday, November 06, 2022

PM's big idea is bad

My first reaction to today's following NZ Herald headline was incredulity:

One big idea - what PM Jacinda Ardern would do if money was not a factor

Why pose such a redundant proposition when governments are scrambling to spend less? Well, most governments.

But then I thought the answer might shed light on just how naive and ineffective the PM is.

Her big idea? Free early childhood education. 

“I’d make it completely free. Completely free. And when I say completely free, I’d also give choice to families about at what point and stage their child accesses it. Because for some we know it provides stability to kids that they might not have in their home life.”

Hang on. Back up. Isn't this putting the cart before the horse?

Perhaps you need to address why 'some' kids don't have stability in their home life.

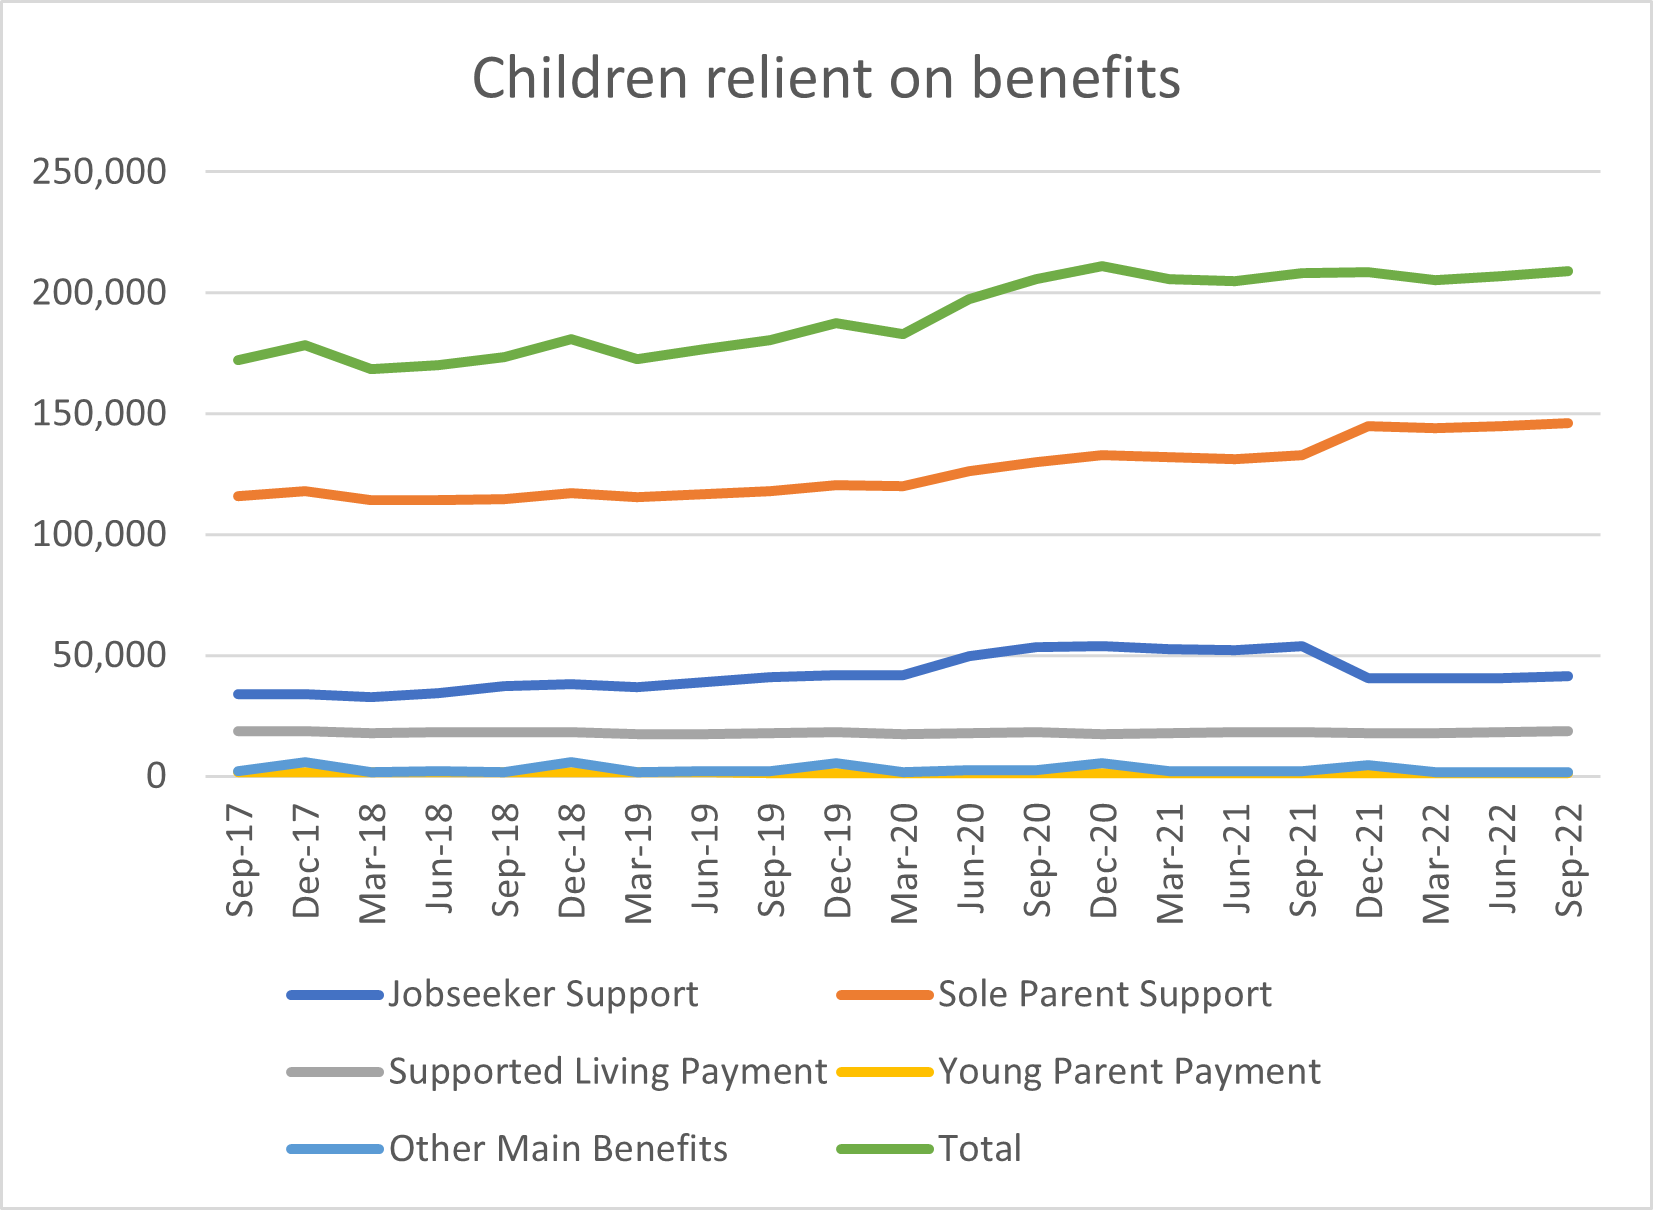
You've already thrown a whole lot more money at the problem due to the first wrong diagnosis and now there are thousands more children in unemployed homes. Dare I say it, unstable homes.

But let's look at the evidence the PM might be inclined to take heed of. Evidence produced under her own administration.

Whether or not early childhood education improves outcomes for children is at best controversial.

In 2019 the Auckland University of Technology (AUT) prepared a paper for MSD which asked, ‘Is participation in Early Childhood Education related to child health and development?’ 

It reported numerous studies (including American, British, Australian) which found the larger the quantity of time spent in non-maternal care, the greater negative effects were. For instance, “A Swiss study has also found that the accumulation of time in group-based childcare specifically was associated with greater externalising (aggression, ADHD symptoms, non-aggressive externalizing behaviours) and internalising (depression, anxiety) behaviours at 7 years.”

AUT noted however, “The Christchurch Health and Development Study found that ECE participation over time was not significantly associated with behavioural outcomes in childhood and adolescence once sociodemographic factors, child-rearing practices and child characteristics were accounted for.”

Analysing recent Growing Up in New Zealand data AUT then concluded, “…more time in ECE per week was inversely associated with the development of emotional difficulties and peer problems.”

This finding, however, is not particularly robust.

Social, emotional and behavioural difficulties (via SDQ) were measured at 24 months. Children in full-time maternal care rated the highest level of ‘abnormal’ difficulties at 21.2 percent. Children in centre-based care recorded only 13.9 percent.

But the highest levels of abnormal difficulties also occurred with unemployed mothers (22.8%) and benefit recipient mothers (36.9%) – the group most likely to be parenting full-time.

The paper’s authors acknowledge, “parents who are employed are more likely to need, afford, and use ECE; this tendency will ‘select’ a particular group of children, many of whom may have different behavioural and health profiles to the converse group.”

Furthermore, in describing the limitations of the paper:

“It is possible that the positive association between child behaviour and ECE is in part due to children with behavioural difficulties being excluded from ECE (reverse causation). Unlike primary school, there is no requirement for early childhood education services to take children who have conduct or peer problems. It is also possible that parents with full time childcare responsibilities of two-year children may rate their behaviour as worse than the parents of children in childcare, because they see them all the time (so may be more aware of their behaviour) and also due to the increased stress of parenting fulltime… Given limitations in the data collection noted elsewhere, it is not possible to determine why attendance appears to protect against emotional difficulties and peer problems, and hence why this finding contrasts with previous research.” (my emphasis)

This inconclusive research could nevertheless be used as an argument to get more children from 'unstable' homes into ECE.

But, and it's a massive 'but', primary school is free (and compulsory) and attendance amongst children from transient (geographical and maternal relationship-wise), dysfunctional families can range from non-existent to patchy. Why would ECE attendance be different?

Probably some level of ECE for children from well-adjusted families is fine (though I still regret buying the 'socialization' idea with my first.)

The problem of children suffering 'abnormal' difficulties often associated with a benefit-dependent parent(s) will not be solved by ever greater removal of responsibility from the parent.  Broken families can't be healed by herding their children into daycare. An ECE teacher cannot be the mother who needs to bond physically and emotionally with her child through constant and positive touch and talk from day one. Free ECE cannot possibly fill the void that comes with not being a wanted child.

We should be glad there is no money for the Prime Minister to indulge in yet another distracting, poorly thought-out, bad idea.


Monday, October 31, 2022

New Report Measures Father Absence in NZ

 New Report Measures Father Absence in NZ


Thousands of New Zealand children struggle with having no father in their lives, and a new report from Family First - WHERE DOES HE LIVE? Measuring Father Absence in New Zealand - finds little change since Children's Commissioner Laurie O'Reilly described fatherless families as the 'greatest social challenge facing New Zealanders' in 1998.


Report author Lindsay Mitchell says, "Last year one in twenty births had no father registered; one in six did not have a father living at the same address as the mother and almost one in five had parents with no stated legal relationship.”


“For the past fifty years married and unmarried births have broadly trended in opposite directions and are steadily converging. In the year to June 2022, 49.8% of all births were unmarried. In the June quarter alone births to unmarried parents surpassed the halfway mark for the first time reaching 50.7%. Children are also increasingly being born to de facto relationships (30% of all births) which do not have the same stability as marriages.”


“Maori children are the most likely to experience father absence. The proportion of Maori babies born to married parents has fallen from a relatively high level of 72% in 1968 to just 20% in the June 2022 quarter. Maori children are the most likely to experience living with a sole parent.”


For children, father absence is associated with poverty, material hardship, abuse and neglect, lower cognitive capacity, substance use, poorer physical and mental health and criminal offending. But estranged fathers can also suffer materially and emotionally. The mortality rate of fathers paying child support is significantly higher than the norm.


Mitchell says, “There are some positive trends for the prospects of father absence reducing. The teenage birth rate is plummeting, and men are first-time fathering when they are older and more stable. But official projections show sole parent families maintaining their current level through to 2043.”


“So there is good and bad news. Actual trends hold some promise - predictions, less so. Perhaps those children who grew up without parental stability are successfully seeking it in their own relationships? Let’s hope so."


Monday, October 24, 2022

Our leaders need to join the right dots

The Minister of Finance and Deputy Prime Minister says:

"We've lifted about 66,000 kids out of poverty in the past few years ..."

What he neglects to add is they have also consigned about 37,000 more to life on a benefit bringing the total to over 209,000.

Robertson continues:

"If we don't have a population that's feeling well, healthy and happy, then they're going to be less productive."

It's a shame he doesn't link the two. New Zealand has long struggled with low productivity. Perhaps that's because there is so much intergenerational welfare dependence?

Early entry into the benefit system is strongly co-related with intergenerational benefit receipt.

MSD's own commissioned analysis found:

The correlation is striking enough to believe that early entry may be a proxy for intergenerational benefit receipt (with the notable exception of teen-aged SLP entrants).

·         The evaluation looked specifically at the share of beneficiaries up to age 25 that can be matched to a record of parental benefit receipt - a “benefit match”. We also looked at the extent of their family’s exposure to benefits, during each matched beneficiary’s teenage years (13-18).

·         These figures show that inter-generational correlations are very strong – most young clients in the benefit system had some exposure to the benefit system through a parent or guardian.

·         Nearly three quarters (74%) of all beneficiaries up to age 25 had a parent on benefit while they were a child, and just over a third (35%) had a parent on benefit throughout their teenage years.

·         The greater the family benefit history the longer the client tended to stay on a benefit, particularly for the Jobseeker benefit.

But that was 2015. When National, thanks to Bill English, was serious about understanding and tackling this long-standing problem. A goal of reducing the number of children in benefit-dependent households was set as part of the Better Public Service goals. Real progress had been made seeing a reduction of 61,000 between 2011 and 2017, yet Labour scrapped the goals.

The gains made have been undone. For instance, noting the final item on the above list, the time people stay on a benefit is getting longer again.

And let's not forget the Prime Minister who said:

 "...if you ask me why I’m in politics, my answer will be simple: children ...” 

But she never ever talks about children on benefits (except when boasting about paying their parents more.) She never acknowledges the evidence that outcomes for poor children on benefits are worse than for poor children with working parents. She certainly steers well away from the subject of intergenerational dependence.

Either she doesn't understand the implications of more children entering the benefit system, or it just doesn't fit with her world view.

If she honestly wanted to make New Zealand the best place in the world to raise children tackling benefit reliance should be her number one priority.


Friday, October 21, 2022

Average future years on a benefit increases again

MSD's Annual Report was released yesterday.

From the CEO's forward:

There is a lot we can reflect on and be proud of over the last year, including:

Getting more people into jobs than ever before

A relentless focus on getting people jobs has seen 226,836 clients move off benefit into work in the last two years – our highest recorded result.

Great. But how many benefits were granted in the same two years?

415,266 

In the past two years there have been more benefit grants than cancellations.

With all the covid disruption to labour markets, movement on and off benefits has been volatile and not the best gauge of success.

Here is, perhaps, the most important indicator:

"The number of years, on average, for which people receiving a benefit at 30 June in the respective year are expected to be supported by a benefit over the remainder of their working lives."


There has been a 20 percent increase in average future years on a benefit over the last five years.

Again, I put this down to expectations built by Labour. Through various policies they have made it easier to get on a benefit and stay on a benefit. Add to this a health system that isn't fixing people ...

Here's a sobering thought.

Right now, that expectancy totals 4.43 million years.


Thursday, October 20, 2022

September benefit stats released - big jump in Supported Living Payment

The Supported Living Payment (SLP) replaced the Invalid's benefit. Officially:

Supported Living Payment is for people who have, or care for someone with, a health condition, injury or disability that limits their ability to work. 

Please note the graph's Y axis is not zeroed in order to show the increase more clearly.


In one year, the number climbed by 4,659 or almost 5 percent. Half of the increase is down to psychological and psychiatric conditions; the gender bias is female and most of the increase is among 55–64-year-olds (though no age group has shown a decrease). NZ Europeans have the largest increase (though it looks proportionate to their share of the population). There is no increase in carers receiving the payment. I would hazard a guess the increases in cardiac, musculoskeletal and cancer conditions reflect delays in diagnosis/treatment - in other words, a failure of the health system.


Sole parent support is on the way back up again though some of the increase is because mothers were transferred back from Jobseeker Support when the subsequent child policy was removed.


Perhaps the most important statistic - the number of children reliant on benefits - climbed through the year to September and now sits at 209,127. Remember that whenever you hear the PM maintaining a success in child poverty reduction.


And finally, there are:


That's 11.1 percent of the 18–64-year-old population and not far off the population of Christchurch.

All of this against record low unemployment.


Friday, October 14, 2022

Relationship between poverty and foodbank use

MSD's annual tome of poverty statistics was released last week.

The NZ Initiative provides a good summary here. Eric Crampton wryly notes:

"Spin machines revved up quickly, trying to find the least indefensible ways of using the data to support whatever position they had before they’d opened the report."

For mine, of interest, was a new section on foodbank use. I have graphed the data below interested in the relationship between foodbank use and child poverty. 

The data features children aged 0-17 in primarily the Auckland region. Foodbank use is at least once in the last 12 months. AHC 50 relates to the percentage of children in households below fifty percent of the median income After Housing Costs and MH 9+ relates to the percentage of children experiencing 9 or more items of material hardship eg going without fresh fruit or doctor visits.


Unsurprisingly in every area the relationship is similar.  But it is certainly not uniform. The shapes of each area cluster differ.

The ratio of AHC50 to foodbank-use shortens moving left to right. In Albert etc. 14 percent are at AHC 50 and 3 percent used foodbanks. In Southern wards the numbers are respectively 25 and 19 percent. The gap is much narrower.

Without knowing how many times beyond once a foodbank was used, the dependency appears disproportionately greater moving left to right.

This might reflect a greater density of foodbanks in poorer areas.

But I also notice the marginal relationship between AHC50 (financial hardship) and MH9+ (material hardship) is not constant. It too tends to close but Western and Howick etc. have the biggest margins. This says to me that low incomes in those areas go further. Perhaps caregivers budget better. Perhaps they carry less debt. There could be a myriad of reasons.

Theories about how to measure poverty have been multiple and varied through the ages. The study of poverty has historic roots. But some have argued it might be better identified and understood by measuring not what goes into a house but what goes out. Expenditure counts as much as income.

This particular report arises from income and says, "The use of expenditure is not generally accepted as an alternative, in part because it also is not a good proxy for reporting consumption possibilities, but also because the quality of the expenditure data is often patchy."

Fair enough but not enough is known about expenditure (bar housing) to properly understand what might make a positive difference. And that is the point of these reports.

(The report does not, by the way, capture recent data or people living in emergency housing.)


Wednesday, October 12, 2022

The unprecedented rush to emergency housing

 The following graph shows the number of MSD clients living in emergency housing up to 2021:


Typically, around 92 percent of clients are housed in hotels/motels with the remainder in hostels/holiday parks.

Then next chart shows a breakdown by area:


I am not convinced that the demand grew solely from "a shortage of affordable housing" - the reason provided by MSD. Neither is population growth a convincing reason with 2016 providing a mid-point - not a beginning.


I think demand was driven largely by expectation.

When people begin to hear about others in their circles being provided with motel accommodation for free they will start to respond. When people see modern state housing being built with attractive income-related rents they will want to get into one even if that means waiting in emergency housing for free for a period.

Belatedly, in October 2021, MSD started to charge emergency housing clients 25% of their income (in line with the income-related rent subsidy) because apparently, "Anecdotal evidence from our front-line staff suggests there may be small numbers of clients in [emergency housing] that are incentivised to access and remain in [emergency housing] when they have an alternative housing option because they face no accommodation costs."

There is some reduction in that year's numbers. But 2022 is shaping up to look more like 2020 based on stats to July 31 (12,465 clients).

No doubt there are rental accommodation shortages (driven by Labour's hostile policies towards landlords) but behavioural economics probably explains a good part of this unprecedented rush to emergency providers.

Purely my opinion of course.

(BTW Rotorua has established a database of accommodation providers classified by whether they provide emergency housing or not. Many do not. I link to it in the interests of helping Rotorua restore its tourism industry. I have many fond family memories of happy holidays spent there.)


Sunday, October 02, 2022

Stoush between collectivist and individualist Māori

A stoush between collectivist and individualist Māori is long overdue. It has simmered for a long time but this week boiled over when Kelvin Davis exposed his thinking for all and sundry to examine. He confirmed that a Māori world with its own set of values exists, and that anyone with even a smidgen of Māori heritage should get themselves into it. It wasn't a kindly suggestion. It was a command. The cost of not complying? Derision and ostracism. It's reminiscent of the treatment handed out to those who don't want to be part of the Gloriavale commune.

The tribe is a communistic unit. The tribe takes precedence. It owns you. Its culture is all-encompassing. It provides strength in numbers, security and identity. But it is also stultifying and limiting depending on which lens it is viewed through. Ultimately, inevitably, whether at the micro or macro level, the question must be answered. Is your allegiance to the tribe, or is it to yourself and your chosen group of family and friends.

If the two overlap, all well and good.

But in New Zealand (and Australia), for tens, maybe hundreds of thousands of Māori, they don't. Mixed partnerships are more common than those with the same ethnicity. And each of these partnerships - many producing children - will face issues of concurrent cultures.

Increasingly, through media and public services, through health, justice and education, the Māori culture is being prioritised. To the point of being romanticized and lionized. Long-standing rules about the state being secular are broken to accommodate Māori spiritualism. Te reo - or knowledge of te ao - is de facto compulsory inasmuch as, if you don't have it there are now careers that are barred to you. The Māori 'team' propelling this are on a roll. They are in ascendancy. They have gathered non-Māori into their tribe with astonishing success and seeming ease, though reflecting on the creeping compulsion maybe 'ease' is the wrong word. As far back as the nineties you wouldn't progress through a public service job interview if unable to demonstrate an understanding and appreciation of the Treaty.

Prior to this compulsory cultural renaissance people managed their own conflicts. Where they had a foot in both camps - the tribe and the alternative - they made their own decisions. Some stayed, some divided their time, some rejected. In the middle of last century sociologists observed Pakeha men who married Māori women tended to move into the tribe; Māori men who married non-Māori moved into the non-tribal society. Tension would have existed always but so did the freedom to choose.

What kind of society wants to remove that freedom? One in which the collective trumps the individual.

Forget all the hoo-ha about culture, values and Māori mysticism. Colonisation, oppression and racism. They are only trinkets to tempt followers of fashion.

What is happening is a clash between philosophies. Politics is the practical expression of philosophy.

So it isn't surprising that the strong-arming to get with the Māori worldview programme is coming from the left (the Labour Māori caucus, Green and Māori Party MPs). And those resisting are coming from the right (National and ACT). What played out in parliament this week, and is still reverberating with non-politicians now entering the fray, is the age-old stoush between collectivism and individualism. It's New Zealand's cold war.

If we are going to be forced to take a side, and mounting evidence points to this eventuality no matter your ethnicity, think of the conflict in these terms.

Do you want to own your own life?


Saturday, October 01, 2022

Pumping up those polls

Stephen Joyce opines in the NZ Herald today about the PM's "performative policy-making":

"I thought we'd reached peak performative decision-making when Jacinda Ardern took offence at Jack Tame pointing out how many of her performative policy announcements hadn't resulted in anything."

Turn the page to witness the PM at WOW last night - peak performative poll-pumping:


The previous post described how Jacinda Ardern has spent 14 hours on her Child Poverty Reduction portfolio in 20 months.  

I wonder what she spent on fittings, rehearsal and performance at WOW?


Monday, September 26, 2022

PM spends 0.2 percent of her time on Child Poverty Reduction?

 A reader sent me the following quote from a Bryce Edward's article at the BFD:

The Prime Minister took on the portfolio of Child Poverty Reduction, as a way of signalling her ambitions to fix the problem. But clearly she has had other priorities.

This was exposed in the release of ministerial diaries last month, which give an indication of how much time ministers spend on any particular portfolio. Between October 2020 and June 2022 Ardern was recorded as spending only 14 hours on this portfolio – an average of only 40 minutes per month. One calculation put this at a meagre 0.2 per cent of her working time on what she said was her most important portfolio.

Yes, I did check the calculations which would have her working eleven-hour days, seven days a week.

Thursday, September 22, 2022

On child poverty, racism and colonisation


A just-published Listener article asks, "Why doesn't middle-class NZ care about child poverty?" It gathers views from half a dozen people including a principal, a teacher, an advocate against child poverty, a charity head, a Māori provider chair and Pasifika social worker. Apparently, they told the Listener that the middle-class has become indifferent to child poverty. Yet a careful reading of the piece finds it is primarily the Child Poverty Action Group advancing the idea that, "For middle white New Zealand, poverty is equated with being brown. This is where the indifference comes from." The Chief Executive of the Auckland City Mission goes further claiming active hostility to solo mothers, especially Māori: "As a society, the narrative is 'how dare you raise a child alone? We are going to make it as hard for you as we can - we will punish you.' And secondly, in our country, poverty has a colour. It is about racism and colonization."

In fact, there are more NZ European children in material hardship than all other ethnicities put together. The table below shows there are 53,000 NZ European compared to a total of 47,000 combined other ethnicities (these are the most recent data reported in June 2021):


Click to view

So poverty doesn’t have a colour. Saying poverty has a colour is a convenience for those who want to blame racism and colonisation.

The next thing of note from the above chart is that Asian children have relatively low rates of material hardship. Is this due to higher incomes? No.

The following chart shows that the percentage of Asian children in the poorest households is on par with Māori at 15%:


Click to view

So low household income does not have a direct relationship with material hardship. How money is budgeted and what it is spent on matters. Asian families are also more likely to derive their income from work. The Ministry of Social Development long ago established that, “Standard of living data show that poor children reliant on government transfers are more likely to be subject to restrictions in key items of consumption than are poor children in families with market income.”

And yet both the head of the Auckland City Mission and convenor for the Child Poverty Action Group call for more government transfers. The former wants anyone raising children to receive in-work tax credits and the latter wants more tax from the “richest ten percent” to fund a universal child benefit (oddly missing that a universal child benefit would go to the children of the richest ten percent.)

The social worker from South Auckland would like to see the recommendations of the Welfare Expert Advisory Group established four years ago implemented. Either he or the writer of the piece claims a review “found that the Government had made no progress on implementing the report’s 42 key objectives.”

That is totally incorrect. For instance, sanctions for not naming the other parent were removed; the ‘subsequent child work obligation’ was abolished: the child support pass-on is implemented; benefits and abatement thresholds were increased; benefits were indexed to wage inflation and accommodation supplements were raised. (This is not an exhaustive list.)

The social worker who wants the recommendations implemented then goes on to argue that “Accommodation supplements hide the fact that rents are too high, so essentially the government is pouring money into private rentals.” High rents are at least partially a result of the government imposing unrealistic housing standards and scrapping tax deductibility, policies he would doubtless approve of.

This disconnect with economic reality characterises suggestions made when those “who see deprivation up close on a daily basis” are asked for their solutions to child poverty. Despite decades of redistributing wealth, the problem persists. Perhaps the prescription is wrong.

If the diagnosis is wrong, it probably is.

If the Chief Executive of the Auckland City Mission stopped for a moment blaming “society” for the poverty of sole parent children and instead reflected on where their fathers are, and why they are absent, a real remedy might reveal itself. Perhaps replacing fathers with the DPB all those years ago wasn’t such a good idea after all?

If the Māori provider chair stopped insisting that child poverty is the “product of colonisation” and reflected on why the children of low-income Asian parents do not suffer disproportionate material deprivation, a real remedy might reveal itself. Perhaps the strong work ethic that typifies immigrants to this country could be celebrated and emulated?

And if indeed the middle-class has become “indifferent to child poverty” perhaps it is because they can see through the many excuses for why it exists.