Thursday, May 19, 2016

Unemployment rate under-estimated


Current unemployment levels could be underestimated by up the 0.5%

Why?

Because the source of the unemployment rate is a sample of around 15,000 households which are compulsorily surveyed.

Naturally enough some people refuse to disclose information, can't be contacted, move, etc.To adjust for this the surveyors weight households with similar characteristics to those not responding. To test how effective this is researchers matched March 2013 HLFS with Census 2013 data.

The results suggest that the calibration employed by the HLFS does a reasonable job of adjusting for non-response (once region is included as a benchmark), and that further non-response adjustments have minimal effect on reducing the bias introduced by non-response.
However,

 Using the linked dataset we discovered that bias from non-response exists in the estimates of labour force status from the HLFS. The unemployment rate in the responding sample is underestimated by around 0.3 percent to 0.5 percent, while the labour force participation rate is underestimated by around 0.2 percent. Unemployed people had both the highest non-contact rate and the highest refusal rate. This differs from other studies’ findings, where employed people were found to be harder to contact (Foster, 1998; Stoop, 2005).

So unemployment could be as high as 6.2%

This problem has always existed but appears to be worsening.

Response rates for the HLFS were around 86 percent on average over the four years to 2014, but there has been a downward trend in response rates in recent years that reached an all-time low in the June 2013 quarter (80.8 percent). 

Still, many countries use a form of the HLFS to assess labour force status and will no doubt have similar problems. Arguably comparability and tracking trends is more important than point-in-time accuracy.

Wednesday, May 18, 2016

Quote of the Day

This sentence leapt out at me from a piece entitled, "Don't be a sucker for socialism" by Glenn Reynolds:

Under capitalism, rich people become powerful. But under socialism, powerful people become rich. 

Tuesday, May 17, 2016

The Moko Rangitoheriri case

Alan Duff savages "Maori violence" and lack of leadership once again.

Back in NZ - and only Auckland - last week it seems as if I never left France.
Except for one major difference, the negative first: a young Maori couple from Taupo convicted of torturing then killing a child under their care. And not one Maori leader stood up and said anything.
Not so young.

As it turns out the male perpetrator - 43 - had been bailed to the address.

CYF has just released a lengthy statement responding to inquiries about the case of Moko Rangitoheriri:

Was CYFS aware David Haerewa was living with Tania Shailer?

No

Did Probations/Corrections inform CYFS that David Haerewa was being paroled to Tania Shailer's address?

You need to speak to Corrections about this.

If this did not happen - why not - as a result of the inquiries into James Whakaruru's death agencies were meant to share information?

See above

Was CYFS aware of David Haerewa's background?

We did not know David was living with Tania.

If not how could that be the case when Women's Refuge was aware of this?

You need to speak with Women’s Refuge.

So much for joined up government.

I don't blame CYF. I don't blame Corrections. There is so much dysfunction nobody can keep tabs on it all.

And I don't blame Maori leadership either.

But the single-most important point Duff makes is this, quoting Jason Witehira :

Mr Witehira said in his acceptance speech, "It's not about who you are, but what you are. It's about attitude and being an individual and having belief in yourself."
You can bet those hideous child-killer monsters were never exposed to any positive, can-do attitude. No. They grew up on a diet of abuse.
Being a self-believing individual is not particularly compatible with the essentially collective, conformist, Maori culture.


Monday, May 16, 2016

Green dogma disabused

Green MP Jan Logie has jumped on the man-bad/woman-good domestic violence band wagon.

Adding insult to injury, she extends her prejudice to the abuse of children.

At last report, 74,785 children and young people aged under 17 were present at domestic violence police call-out in one year. There is a lot at stake in terms of getting the Government’s response to this right.  Men who abuse their partners are also likely to assault their children.....Internationally the most up to date practice clearly states domestic violence best practice needs to be internalised by the child welfare system. It states there needs to be a specific commitment to partnering with adult survivors and to intervening with perpetrators to enhance child safety. If we don’t do that we put women, children and our society at further risk.
A simple graph will suffice to illustrate how ill-founded Logie's bias is:


The stats are slightly dated but that is because their promulgation is infrequent.

Woman abuse and neglect children too. And when they do, they are neither aberrant nor exceptional examples of female perpetration.

Sunday, May 15, 2016

Domestic violence - public attitude can't be railroaded by indoctrinists

In the interests of balance, having been both critical and skeptical earlier last week, I should report that the NZ Herald finally printed a column about family violence that took a differing view from the majority.

The NZ Herald is to be congratulated for its series highlighting NZ's atrocious record of family violence, but there is an inconvenient truth not being spoken, and reinforced by Kyle MacDonald's column Domestic violence is a male problem.
Kyle MacDonald is partly right - but based on the facts, he's also partly wrong. Family violence is not just a male problem. If we as a nation are really serious about reducing family violence, we need to talk about family violence in all its forms and all its causes. The last time I spoke up about this issue was in 2011 and the political response and condemnation was swift.
But I'm more interested in the facts and research and solving the problem than concerns around being politically incorrect.

And Bob McCoskrie goes on to details numerous statistics and research works that support the premise that domestic violence is not just a male issue.

He will be no doubt surprised at the degree of backing he gets from commenters. Almost unanimous.

Thursday, May 12, 2016

How do I trust thee NZ Herald? Let me count the ways

Yesterday, David left a comment that made me go and look at the latest NZ Herald editorial relating to domestic violence. It was titled:

Never any excuse for a man to hit a woman

The number of responses that took issue with the sentiment expressed was surprising.

Now, at the risk of sounding like a conspiracy theorist, I know for a fact that NZ Herald's current modus operandi is achieving website hits.  For example, they set up minimal word (for the attention deficit readers) contrasting views to provoke debates readers will repeatedly return to.

Regarding their anti-domestic violence campaign, I'd accepted their anti-male bias as sincere if misguided.

But I may be a muggins. Perhaps this entire campaign has been set up to antagonize and enrage, thus setting up a flurry of website hits.

Or maybe I am over-thinking it.

It's bad enough not trusting their so-called facts.

It's worse not trusting their motivation.

Flaxmere (updated)

Flaxmere is the 'benefit baby' capital of New Zealand.

The regional DHB does not breakdown births by centre. But if the numbers of babies born in 2015 who were benefit-dependent by year-end are calculated as a percentage of all beneficiaries at that Work and Income Centre, Flaxmere is the highest in the country.

In all of Hawkes Bay DHB region there were 2,215 babies born in 2015.

The region  encompasses  Work and Income Service Centres Flaxmere (96), Hastings East (155), Napier (170), Taradale (47), Waipukarau (26) and Wairoa (49).

A quarter of all babies born in the Hawkes Bay DHB region - 543 - were on welfare directly or shortly after their births.


Draw your own conclusions.

Update: Here is a man who has drawn his. He says (having fostered 200 children in Flaxmere) that the govt rewards children for having children, that govt has "legitimised" it.

Wednesday, May 11, 2016

NZ Herald's domestic violence campaign is not sound

The bias against males proliferating the NZ Herald's campaign against domestic violence was stated blankly by one contributor this morning:

"Domestic violence is a male problem, and women are the victims."
I disagree. Yes, men are more likely to resort to physical abuse but women either provoke or react with their own methods.

Here is data from the NZ Crime Survey . It doesn't understate the incidence of interpersonal crime in the way that reported crime statistics can. The graph shows the % of adults who were a victim of interpersonal violent offences in 2013:


(Right click to enlarge)

The commentary reads:

Overall, we find that women (6%) were more likely than the men (4%) to be the victim of a violent interpersonal offence by an intimate partner in 2013.

- The percentage of women experiencing 1 or more physical offences committed by an intimate partner was 3% in 2013 down from 5% in 2008.
- The percentage of men experiencing 1 or more threat and damage offences committed by an intimate partner was 3% in 2013 down from 4% in 2008.

There is a growing body of belief and advocacy that demands we accept women are beyond reproach.

I don't know what world these people live in.

Sunday, May 08, 2016

Foreigners are taking Kiwi jobs!!

According to Bernard Hickey, writing in today's HOS:
New Zealand created 120,000 new jobs in the past two years, but the number of unemployed and underemployed rose.
How did that happen?
Essentially New Zealand imported a net 123,900 people to do those jobs.
Really?

Hickey has added together the net migration gain for the two years to March 2016. From Stats NZ:
Unadjusted figures showed a record net gain of 67,600 migrants in the March 2016 year. 
The balance, 56,300 was the net figure for the previous year 

What he omits to add is that in the March 2016 year:

1/ New Zealand citizens returning to live in New Zealand accounted for one-quarter of all migrant arrivals

2/ 27,700 arrivals were on student visas

3/ 36,000 arrivals had New Zealand or Australian visas

This idea of foreigners taking Kiwi jobs is another gaining currency (with a good flogging from the they're-taking-our-houses NZ Herald.) There are certainly more immigrants coming to NZ to work and settle. But to talk about "importing" 123,900 workers when many of them are New Zealanders is misleading.

Hickey says that social, justice and educational policy settings are failing to turn out employable Kiwis, or that employers won't pay them enough to make it worth their while.

We all know that welfare is to blame for the situation whereby some New Zealanders have gotten "lazy" (the word a refugee recently used to me to describe people who sit on benefits when he had managed to get himself work with virtually no English and no help from WINZ).

Hickey concludes,

"Simply opening up the doors for more migrants is not the answer in the long run."

Actually it just might be. The kind of people who will make up NZ's population in the future will not tolerate the sort of welfarism which was never a feature of their birth countries. They know how damaging it can be.

Saturday, May 07, 2016

Unemployment rate - how NZ stacks up

The unemployment rate rose slightly from 5.4 to 5.7 in the march quarter. I have only just had chance to look at the tables. What interested me most was the global situation.

That wonderful semi-socialist paradise of Scandinavia  has only one country with a better unemployment rate than NZ - Norway. Denmark is just behind on 5.8; Sweden trails with 7.1 and Finland tails with 9.2 percent.

If you've listened to any of the US presidential campaign speeches - especially Bernie Sanders - you would think the country was utterly stagnant and that unemployment was raging. In reality, at 4.9% their rate is enviable by most other country's standards.

Of course, unemployment rates never tell a complete story.

It's a surprise to see Japan so high (ie lowest unemployment) on the table given their economic troubles. Much of the work is insecure and low paid:

"... the labor participation rate has risen during his three years in office, pushing the unemployment rate to a two-decade low. But the headline figures mask underlying weakness. During Mr. Abe’s tenure, the number of regular workers has fallen, while the percentage of nonregular workers has hit a record. The jump in labor participation has been fueled mostly by an increase in the number of married women and people aged over 60 taking part-time jobs as incomes of heads of households fall and the pension age rises, Goldman Sachs said in a January report."
And Iceland at number one? Not long ago it was bankrupt. Interesting summary of how that played out here:

Further, while Iceland’s recovery has far outpaced those of its peers, it hasn't been wholly without hardship. Employment is up, but credit remains hard to come by, and Icelandic pensions have taken a hit. Worse, the country is struggling to find new ways to diversify its economy; it’s currently promoting tourism and tech startups, but hasn’t exactly found a sector to replace the banks.
That sounds familiar.

At the other end of the spectrum comes the newly  unemployed  Greece, with 1 in 4 with no work, and the traditionally unemployed Spain, with 1 in 5 unemployed. Spain has spent almost 75% of the last 32 years with an unemployment rate in excess of 15 percent.

Out of 34 countries NZ is ranked 12th, just ahead of Australia and behind the US and the UK.

Locally, the key thing to understand is that,

New Zealand's labour force grows 1.5 percent
The labour force increased 1.5 percent in the March 2016 quarter, with 38,000 more people in the labour force. This was the largest quarterly growth since December 2004.
The labour force is those people seeking work. It is a subset of the working age population (currently standing at 69% and known as labour force participation rate).  Of those 38,000 newbies (who could young people entering the working age population, immigrants/ refugees or ex-pats returning, or someone returning to work after raising a family) 10,000 are unemployed.

So even though there were actually more people employed (up 0.2%) over the quarter, the unemployment rate still rose by 0.3%.

Thursday, May 05, 2016

Party donations per MP in 2015


Labour - $8,750
ACT - $162,000
National - $23,728
Greens - $28,571
Maori Party - $14,000
NZ First - $6,666
United Future - $0

Data sources here and here

Sorry about the slip in spelling.

Quote of the Day

"The only freedom which counts is the freedom to do what some other people think to be wrong. There is no point in demanding freedom to do that which all will applaud. All the so-called liberties or rights are things which have to be asserted against others who claim that if such things are to be allowed their own rights are infringed or their own liberties threatened. This is always true, even when we speak of the freedom to worship, of the right of free speech or association, or of public assembly. If we are to allow freedoms at all there will constantly be complaints that either the liberty itself or the way in which it is exercised is being abused, and, if it is a genuine freedom, these complaints will often be justified. There is no way of having a free society in which there is not abuse. Abuse is the very hallmark of liberty."    - Lord Chief Justice Halisham

End of Life Choice Bill still in ballot

A snippet in this morning's DomPost about David Seymour's disappointment that National vetoed a debate on his End of Life Choice Bill confused. Surely it can't be over as quickly and  simply as that?

However the bill is still in the ballot and if it is drawn will have to be debated. Or at least officially rejected by a majority of MPs.

I sincerely hope that it is drawn. Today.

Tuesday, May 03, 2016

Morgan Foundation attacks personal freedom ... again

The Morgan Foundation were at it again last week. Attacking personal freedoms to achieve the society they want. Whether its cats, climate or corpulence, regard for personal choice is utterly disregarded.

If you think I exaggerate read the latest here.

Instead of a facile debate over whether a sugar tax would work or not, we should be discussing which we value more – living in a free society where you can eat what you like and burden the state, or whether we value having a healthy, productive society. 

My response which was published yesterday (with editing):

 Geoff Simmons (Ideology behind the argument against sugar tax, DomPost, April 29) argues against the "freedom of choice" to eat what we like and wants taxes to curb consumption. These taxes will however apply to all consumers, most of whom do not have an over-eating problem. To control the behaviour of a minority, Simmons is completely comfortable with removing the majority's freedom of choice. In fact, he really dislikes freedom of choice, saying it will "clog our hospitals". That's just silly. Poor choice is what leads to obesity and ill-health. A seeming inability to deal with that issue should not lead to further punishment of the majority. Those who would so easily relinquish personal autonomy in favour of state dictates about what and how much should be eaten are frankly, scary.
And for good measure here is another from somebody called Amanda Purdy, published today:


Monday, May 02, 2016

A housing rental crisis?

The NZ Herald has a report  about the Salvation Army handing out increased numbers of food parcels  due to rising housing costs. In Auckland anyway.

Average rents for three-bedroom Otara houses rose from $382 a week in March 2014 to $466 this March
The article doesn't record the source so I am assuming it's from Barfoot and Thompson. Here's their March 2015 chart followed by March 2016.


The rise in the total South Auckland area, for 3 three-bedroom house, is a lot less than in Otara - 7  versus 22 percent.

But even then, Barfoot and Thompson say:
Over the last 12 months, Auckland saw an increase of $28 or 5.8% (for all property types). 
Whereas Stats NZ say, over the same period:

Rentals for housing increased 2.3 percent, with Auckland up 3.2 percent and Canterbury up 1.2 percent. 
3.2% is a much smaller increase than 5.8%

Auckland has always been one of the least affordable rental markets. But because it gets reported so much, people assume the same applies throughout NZ. It doesn't (though it suits the Sallies to fuel that perception when appearing on telly to promote their annual Red Shield Appeal.)

The following is from Statistics NZ  and shows rents as a percentage of equivalised household incomes for each NZ region:

(Left click for full table)

Those stats go to 2012. The average total rent payments in each of the following years has been:

2013  $273.50
2014  $288.90
2015  $301.00

But household incomes are also rising, even for beneficiaries (CPI adjustments yearly and recent $25 raise).

Just going back to Auckland, another aspect of the reported non-affordability is missed, at least when using official stats. Household incomes are equivalised according to number of members. So larger families will have their incomes reduced by the process. This means that the percentage that rent swallows is higher. That would certainly apply in South Auckland.

Sunday, May 01, 2016

Benefit babies at greatest risk

Following up from my previous post, "Intrigued" left a link at Whale Oil saying that the benefit baby statistics correlate strongly with geographic areas for the greatest child risk. He referred to Treasury work. (Follow the link for a further breakdown of the Auckland region.)

Compare my graph to the Treasury's below:


Here is the comment left at Whale Oil in full. Interesting:

"For anyone who has an interest in this area there is now access to useful data via the Integrated Data Infrastructure - a joint project between various departments - Corrections, Health, CYF, W&I and Stats NZ to map where the children at most risk are in NZ. It is no surprise that the areas with the highest welfare dependency (as per Lindsay Mitchell's analysis above) also show areas with the most at risk children. If anyone is interested in seeing the information that is now available and an interactive map of NZ, go to https://shinyapps.stats.govt.n...
And http://www.treasury.govt.nz/pu... A lot of the work being done by MSD on the overhaul of CYF integrates this information and it is a credit to this Government (in my opinion) that they are looking at the real cost to the State over the lifetime of a child born into a family with the identified risk factors (there are 4 key risk indicators) with the aim of investing in social welfare programmes that will (hopefully) mitigate against the perpetual cycle of welfare dependency, child abuse, crime etc and all the worst outcomes for children. It will be interesting to see how it all manifests in the next iteration of CYF but I sincerely hope it works as there are significant problems for tens of thousands of children in NZ. I think it's our best hope yet from what I have seen. After working in this field for nearly 2 decades I can assure you I've seen nothing from the left of the political spectrum or the CPAGs of this world to really come up with a solution for the real "child poverty" in NZ in all its ugly forms - other than use the term as a political club to try and score political points. I've been to the CPAG annual Budget Breakfast analyses in past years and yearned for a shred of common sense or practical and workable solutions from them and come away disillusioned and angry at their ideological grandstanding."

Thursday, April 28, 2016

Where the benefit babies are born


Every year I track how many benefit babies there are relative to the total births. Being a 'benefit baby' means relying on a parent or caregiver's benefit  by the the end of their birth year. Most will become reliant nearer to their birth date rather than first birthday. Many will go on to experience long-term deprivation.

This year I asked for a  breakdown by Work and Income Service Centre. That was provided. Then I asked the Ministry of Health for District Health Board birth data for 2015. They very quickly obliged without an OIA. Credit to them.

It was then straight forward to place each service centre in a DHB  and calculate the percentage of babies in each district that would be benefit-dependent before their first birthday.

TAIRAWHITI

Tairawhiti is Gisborne northwards. Almost one in three children born in 2015 would be on welfare either immediately or shortly thereafter.

This is more than three times the rate of the lowest DHB, Auckland.

AUCKLAND DISPARITY

The disparity, however, within  the greater Auckland region is highlighted by the difference between Counties Manukau at 21.4% and Auckland at less than half that rate at 9.7%. This disparity is far greater than the disparity in the Wellington region (compare Capital and Coast to Hutt.)

HIGH MAORI POPULATIONS

Not surprisingly Tairawhiti is followed by Northland. You will have noticed the tallest columns are those with high Maori populations.(Of all the benefit babies, 54 percent had a Maori parent or caregiver.)

Lakes covers the Rotorua and Taupo region south to Turangi and Whanganui takes in Marton and Taihape.

Hawkes Bay goes to Wairoa in the north and Waipukarau in the south. Counties Manukau is self-explanatory.

These then are the five DHB areas where from 21 to 32 percent of newborns have families unable to support them independently, usually from birth.

COSMOPOLITAN CENTRES DOMINATE THE LOWEST RATES

At the other end are the cosmopolitan centres. In ascending order, Auckland, Christchurch, Dunedin and Wellington.

Every South Island DHB - bar South Canterbury which is essentially Timaru and inland - is below the national average.

CONTRIBUTION TO CHILD POVERTY

Child poverty is largely (though not exclusively) a result of benefit babies.

But it isn't as if Gisborne and Northland have suddenly been plunged into a depression and unemployment crisis. In fact employment in these regions is far better than it's been in the past. It isn't as if these babies are on their parent's unemployment benefit.

Almost three quarters of benefit babies are on a single parent benefit.

There's the nub of the problem. A lack of two committed parents prepared to take financial responsibility for having a child.

(To end on a positive note, the national average is dropping. At long last.)


"Millennials Hate Capitalism Almost as Much as They Hate Socialism"

Experiencing this first-hand on a daily basis makes the content of the following piece from the Reason.com blog all the more relevant:

"When pollsters probe young people further about socialism and capitalism, they tend to find that respondents don't have clear concepts of these economic philosophies. To many millennials, "socialism" doesn't mean a government-managed economy but something like what we have now, only with more subsidized health care, student-loan forgiveness, and mandatory paid parental leave. Millennials were small children, if they were even born yet, when the Soviet Union dissolved. "Socialism" isn't Romania and Yugoslavia but Scandinavia, not Karl Marx and union halls but Bernie Sanders and Twitter."

Friday, April 22, 2016

Must-read from Karl du Fresne

This is a powerful reminder of the grim injustice (in the name of 'justice') ideologues can wreak.

Thursday, April 21, 2016

Latest total benefit numbers - back where we started from

Well, not quite where we started from. That'd be zero. But back where we started from when National took govt.


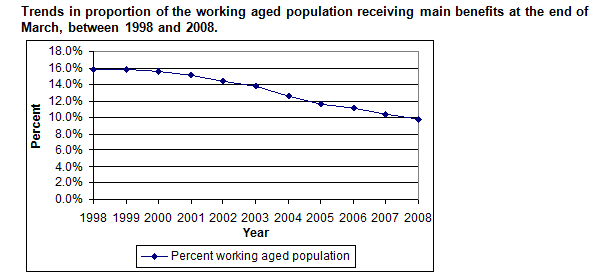
The slow total decline continues. Down to 9.9% of the working age population.

There's a blip with JobSeeker support but nothing dramatic or necessarily trendsetting. It may be saying something about the employment situation. It might just be ageing single parents being moved onto Jobseeker support. Little to be inferred by the reduction in YP/YPP for 18+. The teenage birth rate is dropping so perhaps unsurprising. The old invalid benefit - Supported Living Payment - remains stubbornly high though any reduction is unusual compared to the past few years. Reliance on welfare due to psychological conditions continues to grow. The Sole Parent Support reduction is the biggest and best news leading to fewer children on benefits.


I don't see any smoking gun in the data tables.

Total numbers are dropping. Just not fast enough for some readers. Or me.

As the drop is post GFC  it's worth looking where we were pre GFC.


At 9.9% of the working age population.

(The Super numbers are the big growth area and while most people don't think of it as a benefit, it's included in the tables.

Almost 700,000.

Up 23% since March 2011.)